
As web developers and marketers, we understand the importance of analyzing user behavior on our websites. One of the most effective ways to do this is through heat mapping tools. These tools provide valuable insights into how visitors interact with our web pages, allowing us to optimize our content and improve user experience.
With so many heat mapping tools available, it can be overwhelming to choose the right one for your needs. That’s why we’ve done the research and compiled a list of the best heat mapping tools.
1. Mouseflow
Mouseflow is a powerful heat mapping tool that provides a wide range of features to help website owners, ecommerce businesses, and digital marketers improve user experience and increase conversions. With Mouseflow, you can gain insights into user behavior and make data-driven decisions to optimize your website.
Pros
- Session replay with keystroke logging: Mouseflow allows you to view a recording of each user’s session, including mouse movements, clicks, and keystrokes. This feature makes it easy to identify user pain points and optimize your website accordingly.
- Heatmaps: Mouseflow’s heatmaps provide a visual representation of user behavior on your website. You can view heatmaps for clicks, mouse movements, and scroll reach to gain insights into how users interact with your website.
- Funnel analysis: Mouseflow’s funnel analysis feature allows you to track users as they move through your website’s conversion funnel. You can identify where users drop off and optimize those areas to increase conversions.
- Form analytics: Mouseflow’s form analytics feature provides insights into how users interact with your website’s forms. You can identify where users abandon forms and optimize those areas to increase form completions.
- Extensive filter options: Mouseflow makes it easy to slice your data any way you want with its extensive filter options. You can filter your data by device type, browser, location, and more.
Cons
- Limited free plan: Mouseflow’s free plan is limited to 100 recording sessions per month. If you want to unlock all of Mouseflow’s features, you will need to upgrade to a paid plan.
- Limited integrations: While Mouseflow can be integrated with Google Analytics and Adobe Analytics, it has limited integrations with other third-party tools.
With its session replay, heatmaps, funnel analysis, form analytics, and extensive filter options, Mouseflow is a great choice for anyone looking to gain insights into user behavior on their website.
2. Lucky Orange

Lucky Orange is a powerful heat mapping tool that offers a range of features to help website owners optimize their pages. Here are some pros and cons of using Lucky Orange:
Pros
- Dynamic Heatmaps: Lucky Orange’s dynamic heatmaps capture your changes in real-time, unlike other tools that require you to set up new snapshots or experiments every time you make a change. This means that you can instantly see the impact of your changes on your website’s performance.
- Event-based Session Recordings: Lucky Orange’s session recordings are event-based, which means that you can quickly find and watch replays of frustrated, confused, or engaged visitors. This feature allows you to see exactly where visitors are getting stuck on your site and make changes to improve their experience.
- Live View: Lucky Orange’s live view feature allows you to see what visitors are doing on your site in real-time. This feature is useful for monitoring traffic spikes, identifying potential issues, and improving your website’s overall performance.
- Live Chat: Lucky Orange’s live chat feature allows you to communicate with visitors who are currently on your site. This feature is useful for providing customer support, answering questions, and building relationships with your visitors.
- Filterable Saved Segments: Lucky Orange allows you to create filterable saved segments of your website’s traffic. This feature is useful for identifying trends, tracking specific user behaviors, and improving your website’s overall performance.
Cons
- Price: Lucky Orange is not the cheapest heat mapping tool on the market. However, the platform’s features and capabilities justify the cost.
- Learning Curve: Lucky Orange can be complex to navigate and set up, which may require some time to learn. However, the platform’s support team is available to help you get started and answer any questions you may have.
Overall, Lucky Orange is an excellent heat mapping tool that offers a range of features to help website owners optimize their pages. Its dynamic heatmaps, event-based session recordings, live view, live chat, and filterable saved segments make it a valuable asset for any website owner looking to improve their website’s performance.
3. VWO
We highly recommend VWO as one of the best heat mapping tools in the market. It offers a wide range of features that can help you optimize your website for conversions.
Pros
- Visitor Segmentation: VWO has full visitor segmentation, which means you can analyze the behavior of specific groups of visitors. This can help you identify patterns and optimize your website accordingly.
- Customizable Analytics and Reporting: The overall analytics and reporting are customizable so you can zero in on specific factors. This can help you identify areas of your website that need improvement.
- Engage Tool: VWO Engage even has a tool for Facebook Messenger and one for cart abandonment campaigns. This can help you improve your engagement and reduce cart abandonment rates.
- Affordable Pricing: Each set of tools has its own price. VWO Insights is $169 per month. VWO Testing is $199 per month. Compared to other heat mapping tools, VWO offers affordable pricing.
Cons
- Limited Integrations: VWO has limited integrations with other tools. This can make it difficult to use VWO with other tools you may be using.
- Steep Learning Curve: VWO can be difficult to learn, especially for beginners. It may take some time to get used to the platform and its features.
Overall, VWO is a great heat mapping tool that can help you optimize your website for conversions. While it does have some drawbacks, its affordable pricing and customizable analytics make it a great option for businesses of all sizes.
4. Attention Insight

Attention Insight is an AI-driven heat mapping tool that provides ultra-detailed heat maps to help you peek deeper into your website visitors’ behavior. Here are some of the pros and cons of using Attention Insight:
Pros
- AI-generated data: Attention Insight provides AI-generated data about what seeks your user’s attention while engaging with your content. This can help you identify the most engaging parts of your website and optimize your content accordingly.
- High accuracy: Attention Insight’s AI predicts changes in visual attention based on 70,000 images from eye-tracking studies. This results in attention predictions that are 90% accurate for web images and 94% accurate for non-web images.
- Easy to use: Attention Insight is easy to use and provides quick results. With just a few clicks, you can generate detailed heat maps that can help you improve your website’s user experience.
Cons
- Limited features: Attention Insight is primarily a heat mapping tool and does not provide other features like session replay or A/B testing. If you need these features, you may need to use other tools in conjunction with Attention Insight.
- Limited integrations: Attention Insight does not integrate with as many third-party tools as some of its competitors. This can make it difficult to use in conjunction with other tools you may be using to track user behavior.
Overall, Attention Insight is a great tool for those looking to generate detailed heat maps and gain insights into their website visitors’ behavior.
5. Smartlook
Smartlook is a powerful heat mapping tool that can be used on websites as well as native iOS and Android mobile apps and games. It offers a range of features, including heatmaps, session recordings, event tracking, and funnel analysis.
Pros
- Easy to use: Smartlook is a user-friendly tool that is easy to navigate, even for beginners.
- Heatmaps: Smartlook’s heatmaps provide a visual representation of user behavior, making it easy to identify areas of interest and potential issues.
- Session recordings: Smartlook records 100% of all sessions by default, providing an accurate view of user behavior.
- Event tracking: Smartlook’s event tracking feature allows users to track specific actions, such as clicks and form submissions.
- Funnel analysis: Smartlook’s funnel analysis feature enables users to track user behavior through a series of steps, making it easy to identify areas where users drop off.
Cons
- Limited free plan: Smartlook’s free plan only records up to 3,000 user sessions per month, which may not be sufficient for larger websites or apps.
- Limited integrations: Smartlook has limited integrations with other tools, which may be a drawback for users who rely on multiple tools for their analytics.
Overall, Smartlook is a reliable and user-friendly heat mapping tool that offers a range of features to help users analyze user behavior on websites and mobile apps.
6. Inspectlet
Inspectlet is a powerful heatmap software and user behavior analytics tool that allows us to observe all the actions users take on our website. It provides an excellent heat map functionality that quickly identifies strengths and weaknesses on any page.
Pros
- Video recording: Inspectlet records videos of our visitors as they use our site, allowing us to see everything they do. We can see every mouse movement, scroll, click, and keypress on our site. This feature helps us to understand how visitors interact with our website and identify any issues or areas for improvement.
- Advanced filters: Inspectlet provides us with a range of filters that help us to segment our data and analyze visitor behavior based on various parameters such as location, device type, and more. This feature helps us to gain deeper insights into our visitors’ behavior and tailor our website accordingly.
- Comprehensive features: Inspectlet offers a range of other features such as form analytics, funnel analysis, and session recording that help us to optimize our website and improve our conversion rates.
Cons
- Learning curve: Inspectlet can be a bit overwhelming for beginners due to the sheer amount of data it provides. It may take some time to get used to the interface and understand how to use it effectively.
- Pricing: Inspectlet may not be suitable for smaller websites or businesses with limited budgets as it can be quite expensive compared to other heatmap software tools.
Overall, Inspectlet is an excellent heatmap software tool that provides us with a wealth of data and insights into our visitors’ behavior. Its powerful features and filters make it an ideal choice for businesses looking to optimize their website and improve their conversion rates.
7. Plerdy
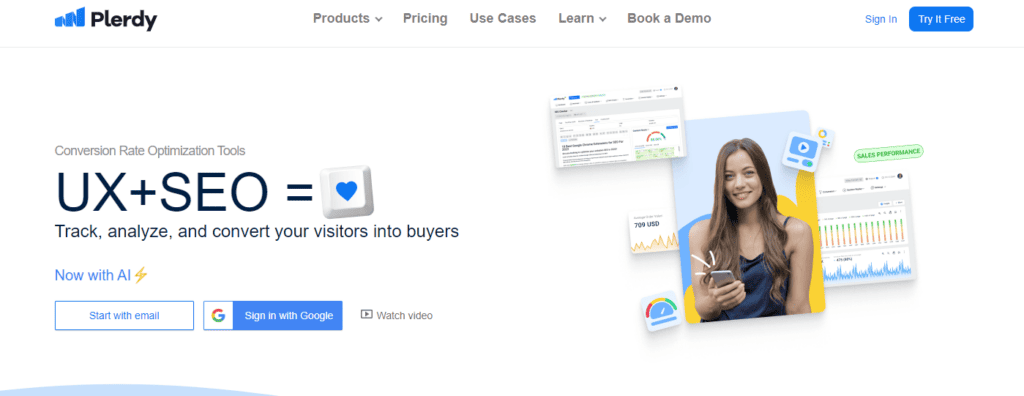
We recommend Plerdy as one of the best heat mapping tools available. Plerdy’s heatmap software is designed to track user interactions and provide businesses with actionable insights to optimize their digital experiences.
Pros
- Accuracy: Plerdy’s heatmap software records clicks and creates reports with 99% accuracy (without sampling data). This makes it a reliable tool for businesses to make data-driven decisions.
- Multiple website types: Plerdy’s heatmap tracking collects data from various website types, including Angular (SPA), Shopify, Magento, WordPress, Content Management Systems (CMS), and others. This makes it a versatile tool for businesses of all types and sizes.
- Large-volume websites: Plerdy’s heatmap tracks large-volume websites that generate millions of daily page views per day. This makes it an ideal choice for businesses with high traffic websites.
- Comprehensive real-time content analysis: Plerdy goes beyond heat mapping to offer an impressive array of features. This tool provides users with key insights into user experience data by recording all the clicks on a web page. It delivers over 40 elements of analysis, including scroll depth and more.
Cons
- Limited integrations: Plerdy has limited integrations with other tools and platforms. This may make it difficult for businesses to use Plerdy in conjunction with their existing tools.
- Limited customization: Plerdy’s heatmap software has limited customization options. This may make it difficult for businesses to tailor the tool to their specific needs.
Overall, Plerdy is a great choice for businesses looking for a reliable and comprehensive heat mapping tool. Its accuracy, versatility, and real-time content analysis make it an ideal choice for businesses of all sizes. However, its limited integrations and customization options may be a drawback for some businesses.
Conclusion
In conclusion, heat mapping tools are an essential part of website optimization. By analyzing user behavior and engagement, we can gain valuable insights into how to improve our website’s conversion rates.
Each of these tools offers unique features and benefits, so it’s important to evaluate your specific needs and goals when choosing a heat mapping tool.
In addition to heat mapping, many of these tools also offer visitor recordings, conversion funnel analysis, and other useful features for understanding user behavior. By combining these tools with other web analytics tools, such as Google Analytics, you can gain a more complete picture of user behavior on your site.
Frequently Asked Questions
What are some popular online heat mapping tools?
There are many online heat mapping tools available, but some of the most popular ones include Mouseflow, Lucky Orange and VWO. Each tool has its own unique features and capabilities, so it’s important to choose the one that best fits your needs.
Which heat mapping tool provides the most comprehensive analysis?
While many heat mapping tools offer comprehensive analysis, Mouseflow and Lucky Orange are often considered the most comprehensive. Mouseflow offers session replay with keystroke logging, heatmaps, funnel analysis, and form analytics. Lucky Orange offers dynamic heat maps paired with surveys and session recordings.
What is the process for creating a high-quality heat map?
To create a high-quality heat map, you first need to choose the right heat mapping tool for your needs. Once you’ve chosen a tool, you’ll need to set your tracking settings and goals, choose the specific web pages or areas to track, and generate your heat maps to visualize your website data. It’s also important to analyze your heat maps effectively to gain actionable insights.
